[150]:
import pandas as pd
import numpy as np
import datashader
import bokeh.plotting
import collections
import xarray
import time
from bokeh.palettes import Colorblind7 as palette
%config InlineBackend.figure_format='retina'
bokeh.plotting.output_notebook()

# create some data worth plotting
#nx = 50
x_range=[0,10]
y_range=[-0.5,1.5]
#x = np.linspace(0, np.pi * 2, nx)
#y = np.sin(x)
#n = 10000
#data = np.empty([n+1, len(y)])
#data[0] = x
#prng = np.random.RandomState(123)
#
## scale the data using a random normal distribution
#offset = prng.normal(0, 0.1, n).reshape(n, -1)
#data[1:] = y
#data[1:] += offset
data=np.loadtxt("C-800-coordN").T
print(data.shape)

# make some data noisy
#n_noisy = prng.randint(0, n,5)
#for i in n_noisy:
#    data[i+1] += prng.normal(0, 0.5, nx)

dfs = []
split = pd.DataFrame({'x': [np.nan]})
for i in range(len(data)-1):
    x = data[0]
    y = data[i+1]
    df = pd.DataFrame({'x': x, 'y': y})
    dfs.append(df)
    dfs.append(split)

df = pd.concat(dfs, ignore_index=True)

canvas = datashader.Canvas(x_range=x_range, y_range=y_range,
                           plot_height=100, plot_width=100)
agg = canvas.line(df, 'x', 'y', datashader.count())
img = datashader.transfer_functions.shade(agg,how='log')
#img = datashader.transfer_functions.shade(agg, how='eq_hist')
img
(2, 612012)
[150]:

[ ]:
[37]:
import pandas as pd
import numpy as np
import datashader
import bokeh.plotting
from bokeh.palettes import Colorblind7 as palette
from datashader.colors import inferno, viridis
%config InlineBackend.figure_format='retina'
bokeh.plotting.output_notebook()

x_range=[0,10]
y_range=[-0.5,1.5]

data=np.loadtxt("C-800-coordN").T
print(data.shape)

df=pd.DataFrame(dict(x=data[0,1000:],y=data[1,1000:]))

canvas = datashader.Canvas(x_range=x_range, y_range=y_range,
                           plot_height=1000, plot_width=1000)
agg = canvas.line(df, 'x', 'y', datashader.count())
#img = datashader.transfer_functions.shade(agg,cmap=viridis,how='log')
#img = datashader.transfer_functions.shade(agg,cmap=inferno,how='eq_hist')
img = datashader.transfer_functions.shade(agg,cmap=viridis,how='eq_hist')
#img = datashader.transfer_functions.shade(agg, how='eq_hist')
img
import holoviews as hv
from holoviews.operation.datashader import datashade, dynspread
hv.extension('bokeh')
#dynspread(datashade(hv.Path(df),cmap=viridis))
dynspread(datashade(hv.Points(df),cmap=viridis))
(2, 612012)


[37]:
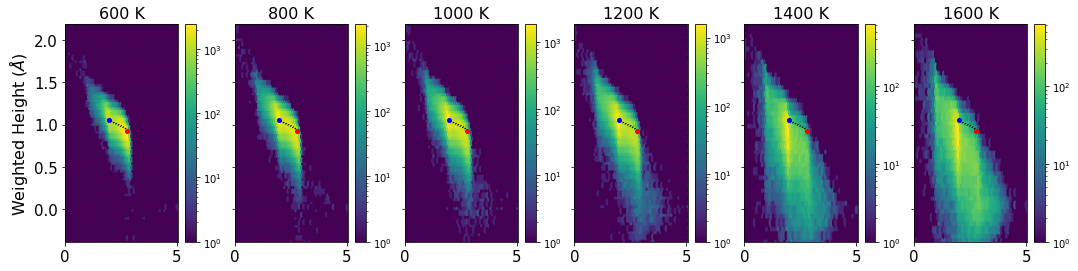
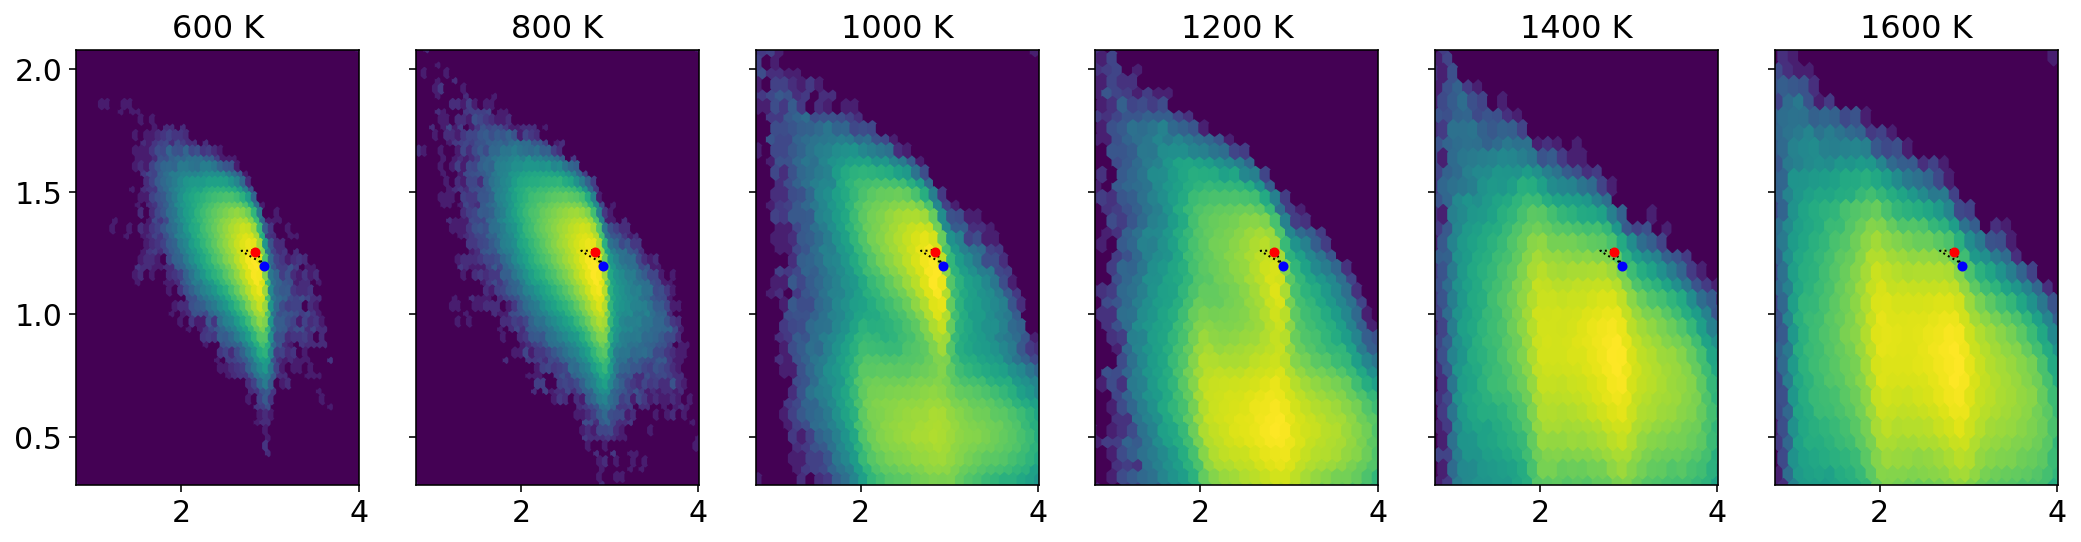
[2]:
import numpy as np
import matplotlib.pyplot as plt

ele='H'

neb=np.loadtxt(ele+'-neb-coordN')
data=np.loadtxt(ele+'-800-coordN')
x=data[:,0]
y=data[:,1]
xmin = 0
xmax = x.max()
ymin = y.min()
ymax = y.max()

fig, axs = plt.subplots(ncols=6, sharey=True, figsize=(16, 4))
fig.subplots_adjust(hspace=0.5, left=0.07, right=0.93)

T=[600,800,1000,1200,1400,1600]

for i in range(6):
    filename=ele+'-'+str(T[i])+"-coordN"

    data=np.loadtxt(filename)
    box=[[xmin,ymin],[xmax,ymax]]
    data=np.append(data,box,axis=0)
    x=data[:,0]
    y=data[:,1]

    ax = axs[i]
    hb = ax.hexbin(x, y, gridsize=50, bins='log', cmap='viridis')
    ax.set(xlim=(xmin, xmax), ylim=(ymin, ymax))
    ax.set_title(str(T[i])+" K",fontsize=16)
    if(i==0):
        ax.set_ylabel("Weighted Height ($\AA$)",fontsize=16)
    cb = fig.colorbar(hb, ax=ax)
    ax.plot(neb[:,0],neb[:,1],'k-',linewidth=1,linestyle='dotted')
    ax.plot(neb[0,0],neb[0,1],'ro',ms=4)
    ax.plot(neb[8,0],neb[8,1],'bo',ms=4)
    ax.tick_params(axis='both', which='major', labelsize=15)
    #cb.set_label('log10(N)')
plt.savefig("b.jpg",dpi=300)
[1]:
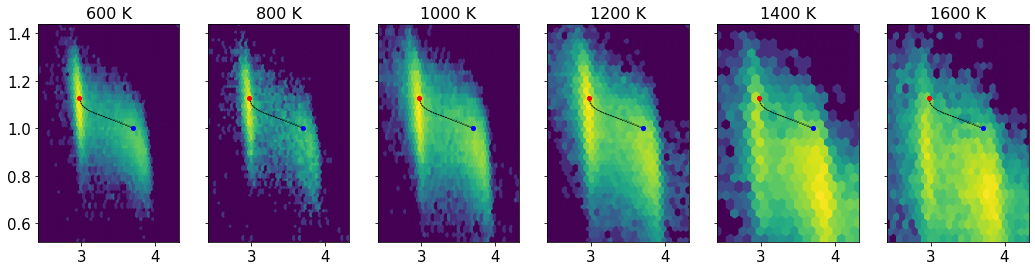
import numpy as np
import matplotlib.pyplot as plt

ele='CH'

neb=np.loadtxt(ele+'-neb-coordN')
data=np.loadtxt(ele+'-800-coordN')
x=data[:,0]
y=data[:,1]
xmin = x.min()
xmax = x.max()
ymin = y.min()
ymax = y.max()

fig, axs = plt.subplots(ncols=6, sharey=True, figsize=(16, 4))
fig.subplots_adjust(hspace=0.5, left=0.07, right=0.93)

T=[600,800,1000,1200,1400,1600]

for i in range(6):
    filename=ele+'-'+str(T[i])+"-coordN"

    data=np.loadtxt(filename)
    box=[[xmin,ymin,0,0],[xmax,ymax,0,0]]
    data=np.append(data,box,axis=0)
    x=data[:,0]
    y=data[:,1]

    ax = axs[i]
    hb = ax.hexbin(x, y, gridsize=50, bins='log', cmap='viridis')
    ax.set(xlim=(xmin, xmax), ylim=(ymin, ymax))
    ax.set_title(str(T[i])+" K",fontsize=16)
    #cb = fig.colorbar(hb, ax=ax)
    #ax.plot(neb[:,0],neb[:,1],'w-')
    ax.plot(neb[:,0],neb[:,1],'k-',linewidth=1,linestyle='dotted')
    ax.plot(neb[0,0],neb[0,1],'ro',ms=4)
    ax.plot(neb[8,0],neb[8,1],'bo',ms=4)
    ax.tick_params(axis='both', which='major', labelsize=15)
    #cb.set_label('log10(N)')

plt.show()
[4]:
import numpy as np
import matplotlib.pyplot as plt
from scipy.stats import gaussian_kde

ele='CH'

neb=np.loadtxt(ele+'-neb-coordN')
data=np.loadtxt(ele+'-800-coordN')
x=data[:,0]
y=data[:,1]
xmin = x.min()
xmax = x.max()
ymin = y.min()
ymax = y.max()

xgrid = np.linspace(xmin, xmax, 100)
ygrid = np.linspace(ymin, ymax, 100)
Xgrid, Ygrid = np.meshgrid(xgrid, ygrid)

fig, axs = plt.subplots(ncols=6, sharey=True, figsize=(16, 4))
fig.subplots_adjust(hspace=0.5, left=0.07, right=0.93)

T=[600,800,1000,1200,1400,1600]

for i in range(6):
    filename=ele+'-'+str(T[i])+"-coordN"

    data=np.loadtxt(filename)
    box=[[xmin,ymin,0,0],[xmax,ymax,0,0]]
    data=np.append(data,box,axis=0)
    x=data[:,0]
    y=data[:,1]
    kde=gaussian_kde(np.vstack([x,y]))
    Z = kde.evaluate(np.vstack([Xgrid.ravel(), Ygrid.ravel()]))

    ax = axs[i]
    #hb = ax.hexbin(x, y, gridsize=50, bins='log', cmap='viridis')
    ax.imshow(Z.reshape(Xgrid.shape),
           origin='lower', aspect='auto',
           extent=[xmin,xmax,ymin,ymax],
           cmap='viridis')
    #ax.set(xlim=(xmin, xmax), ylim=(ymin, ymax))
    ax.set_title(str(T[i])+" K",fontsize=16)
    #cb = fig.colorbar(hb, ax=ax)
    #ax.plot(neb[:,0],neb[:,1],'w-')
    ax.plot(neb[:,0],neb[:,1],'k-',linewidth=1,linestyle='dotted')
    ax.plot(neb[0,0],neb[0,1],'ro',ms=4)
    ax.plot(neb[8,0],neb[8,1],'bo',ms=4)
    ax.tick_params(axis='both', which='major', labelsize=15)
    #cb.set_label('log10(N)')

plt.show()
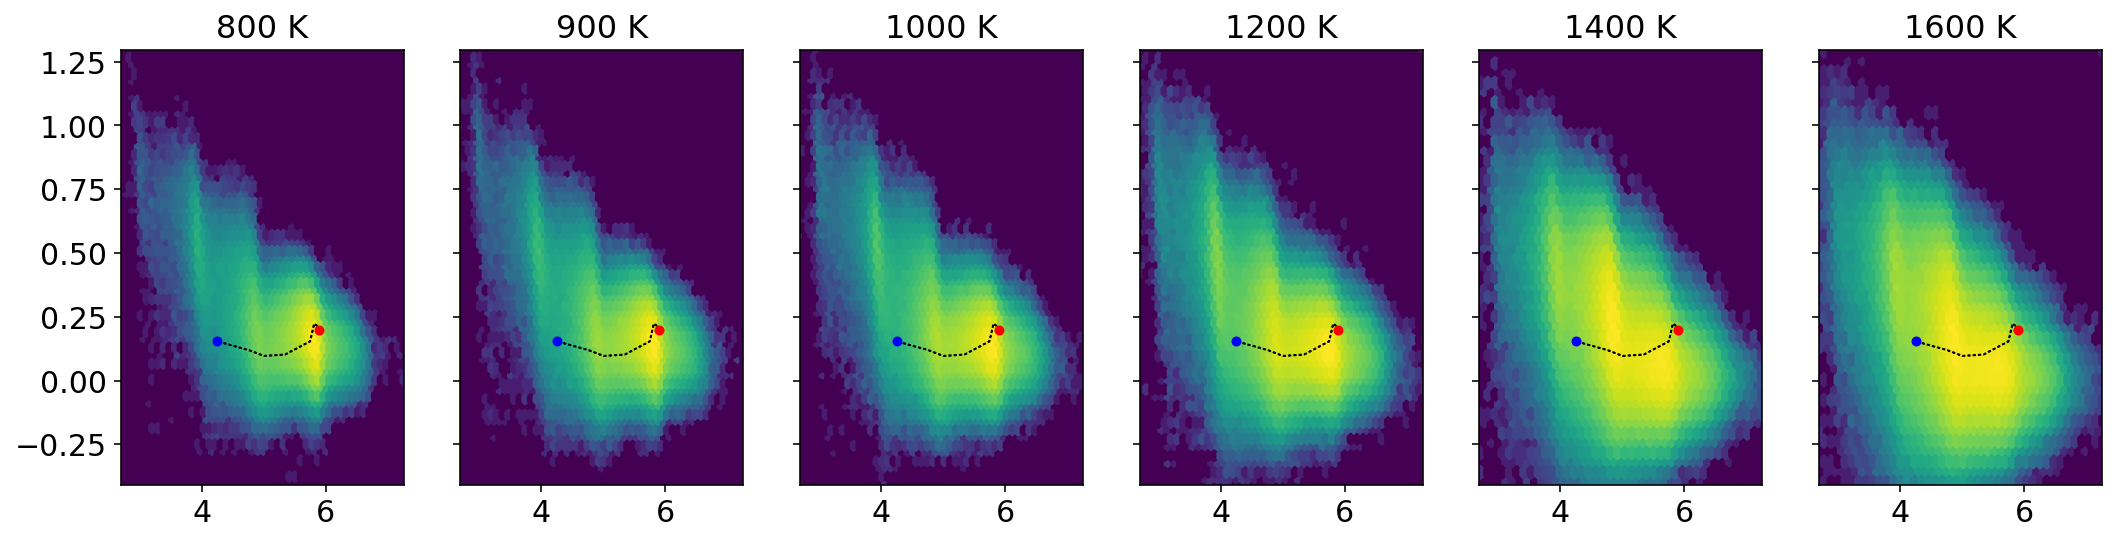
[8]:
import numpy as np
import matplotlib.pyplot as plt
from matplotlib.colors import LogNorm
from scipy.stats import gaussian_kde

ele='CH'

neb=np.loadtxt(ele+'-neb-coordN')
data=np.loadtxt(ele+'-800-coordN')
x=data[:,0]
y=data[:,1]
xmin = x.min()
xmax = x.max()
ymin = y.min()
ymax = y.max()

xgrid = np.linspace(xmin, xmax, 100)
ygrid = np.linspace(ymin, ymax, 100)
Xgrid, Ygrid = np.meshgrid(xgrid, ygrid)

fig, axs = plt.subplots(ncols=6, sharey=True, figsize=(16, 4))
fig.subplots_adjust(hspace=0.5, left=0.07, right=0.93)

T=[600,800,1000,1200,1400,1600]

for i in range(6):
    filename=ele+'-'+str(T[i])+"-coordN"

    data=np.loadtxt(filename)
    box=[[xmin,ymin,0,0],[xmax,ymax,0,0]]
    data=np.append(data,box,axis=0)
    x=data[:,0]
    y=data[:,1]
    kde=gaussian_kde(np.vstack([x,y]))
    Z = kde.evaluate(np.vstack([Xgrid.ravel(), Ygrid.ravel()]))

    ax = axs[i]
    #hb = ax.hexbin(x, y, gridsize=50, bins='log', cmap='viridis')
    ax.imshow(Z.reshape(Xgrid.shape),
           origin='lower', aspect='auto',
           extent=[xmin,xmax,ymin,ymax],
           cmap='viridis')
    #ax.set(xlim=(xmin, xmax), ylim=(ymin, ymax))
    ax.set_title(str(T[i])+" K",fontsize=16)
    #cb = fig.colorbar(hb, ax=ax)
    #ax.plot(neb[:,0],neb[:,1],'w-')
    ax.plot(neb[:,0],neb[:,1],'k-',linewidth=1,linestyle='dotted')
    ax.plot(neb[0,0],neb[0,1],'ro',ms=4)
    ax.plot(neb[8,0],neb[8,1],'bo',ms=4)
    ax.tick_params(axis='both', which='major', labelsize=15)
    #cb.set_label('log10(N)')

plt.show()
[137]:
import numpy as np
import matplotlib.pyplot as plt

ele='C2'

neb=np.loadtxt(ele+'-neb-coordN')
data=np.loadtxt(ele+'-800-coordN')
x=data[:,0]
y=data[:,1]
xmin = x.min()
xmax = x.max()
ymin = y.min()
ymax = y.max()

fig, axs = plt.subplots(ncols=6, sharey=True, figsize=(16, 4))
fig.subplots_adjust(hspace=0.5, left=0.07, right=0.93)

T=[600,800,1000,1200,1400,1600]

for i in range(6):
    filename=ele+'-'+str(T[i])+"-coordN"

    data=np.loadtxt(filename)
    box=[[xmin,ymin,0,0],[xmax,ymax,0,0]]
    data=np.append(data,box,axis=0)
    x=data[:,0]
    y=data[:,1]

    ax = axs[i]
    hb = ax.hexbin(x, y, gridsize=50, bins='log', cmap='viridis')
    ax.set(xlim=(xmin, xmax), ylim=(ymin, ymax))
    ax.set_title(str(T[i])+" K",fontsize=16)
    #cb = fig.colorbar(hb, ax=ax)
    #ax.plot(neb[:,0],neb[:,1],'w-')
    ax.plot(neb[:,0],neb[:,1],'k-',linewidth=1,linestyle='dotted')
    ax.plot(neb[0,0],neb[0,1],'ro',ms=4)
    ax.plot(neb[8,0],neb[8,1],'bo',ms=4)
    ax.tick_params(axis='both', which='major', labelsize=15)
    #cb.set_label('log10(N)')

plt.show()
[134]:
import numpy as np
import matplotlib.pyplot as plt

ele='C'

neb=np.loadtxt(ele+'-neb-coordN')
data=np.loadtxt(ele+'-1000-coordN')
x=data[:,0]
y=data[:,1]
xmin = x.min()
xmax = x.max()
ymin = y.min()
ymax = y.max()

fig, axs = plt.subplots(ncols=6, sharey=True, figsize=(16, 4))
fig.subplots_adjust(hspace=0.5, left=0.07, right=0.93)

T=[800,900,1000,1200,1400,1600]

for i in range(6):
    filename=ele+'-'+str(T[i])+"-coordN"

    data=np.loadtxt(filename)
    x=data[:,0]
    y=data[:,1]

    ax = axs[i]
    hb = ax.hexbin(x, y, gridsize=50, bins='log', cmap='viridis')
    ax.set(xlim=(xmin, xmax), ylim=(ymin, ymax))
    ax.set_title(str(T[i])+" K",fontsize=16)
    #cb = fig.colorbar(hb, ax=ax)
    ax.plot(neb[:,0],neb[:,1],'w-')
    ax.plot(neb[0,0],neb[0,1],'ro',ms=4)
    ax.plot(neb[8,0],neb[8,1],'bo',ms=4)
    ax.tick_params(axis='both', which='major', labelsize=15)
    #cb.set_label('log10(N)')

plt.show()
[ ]:
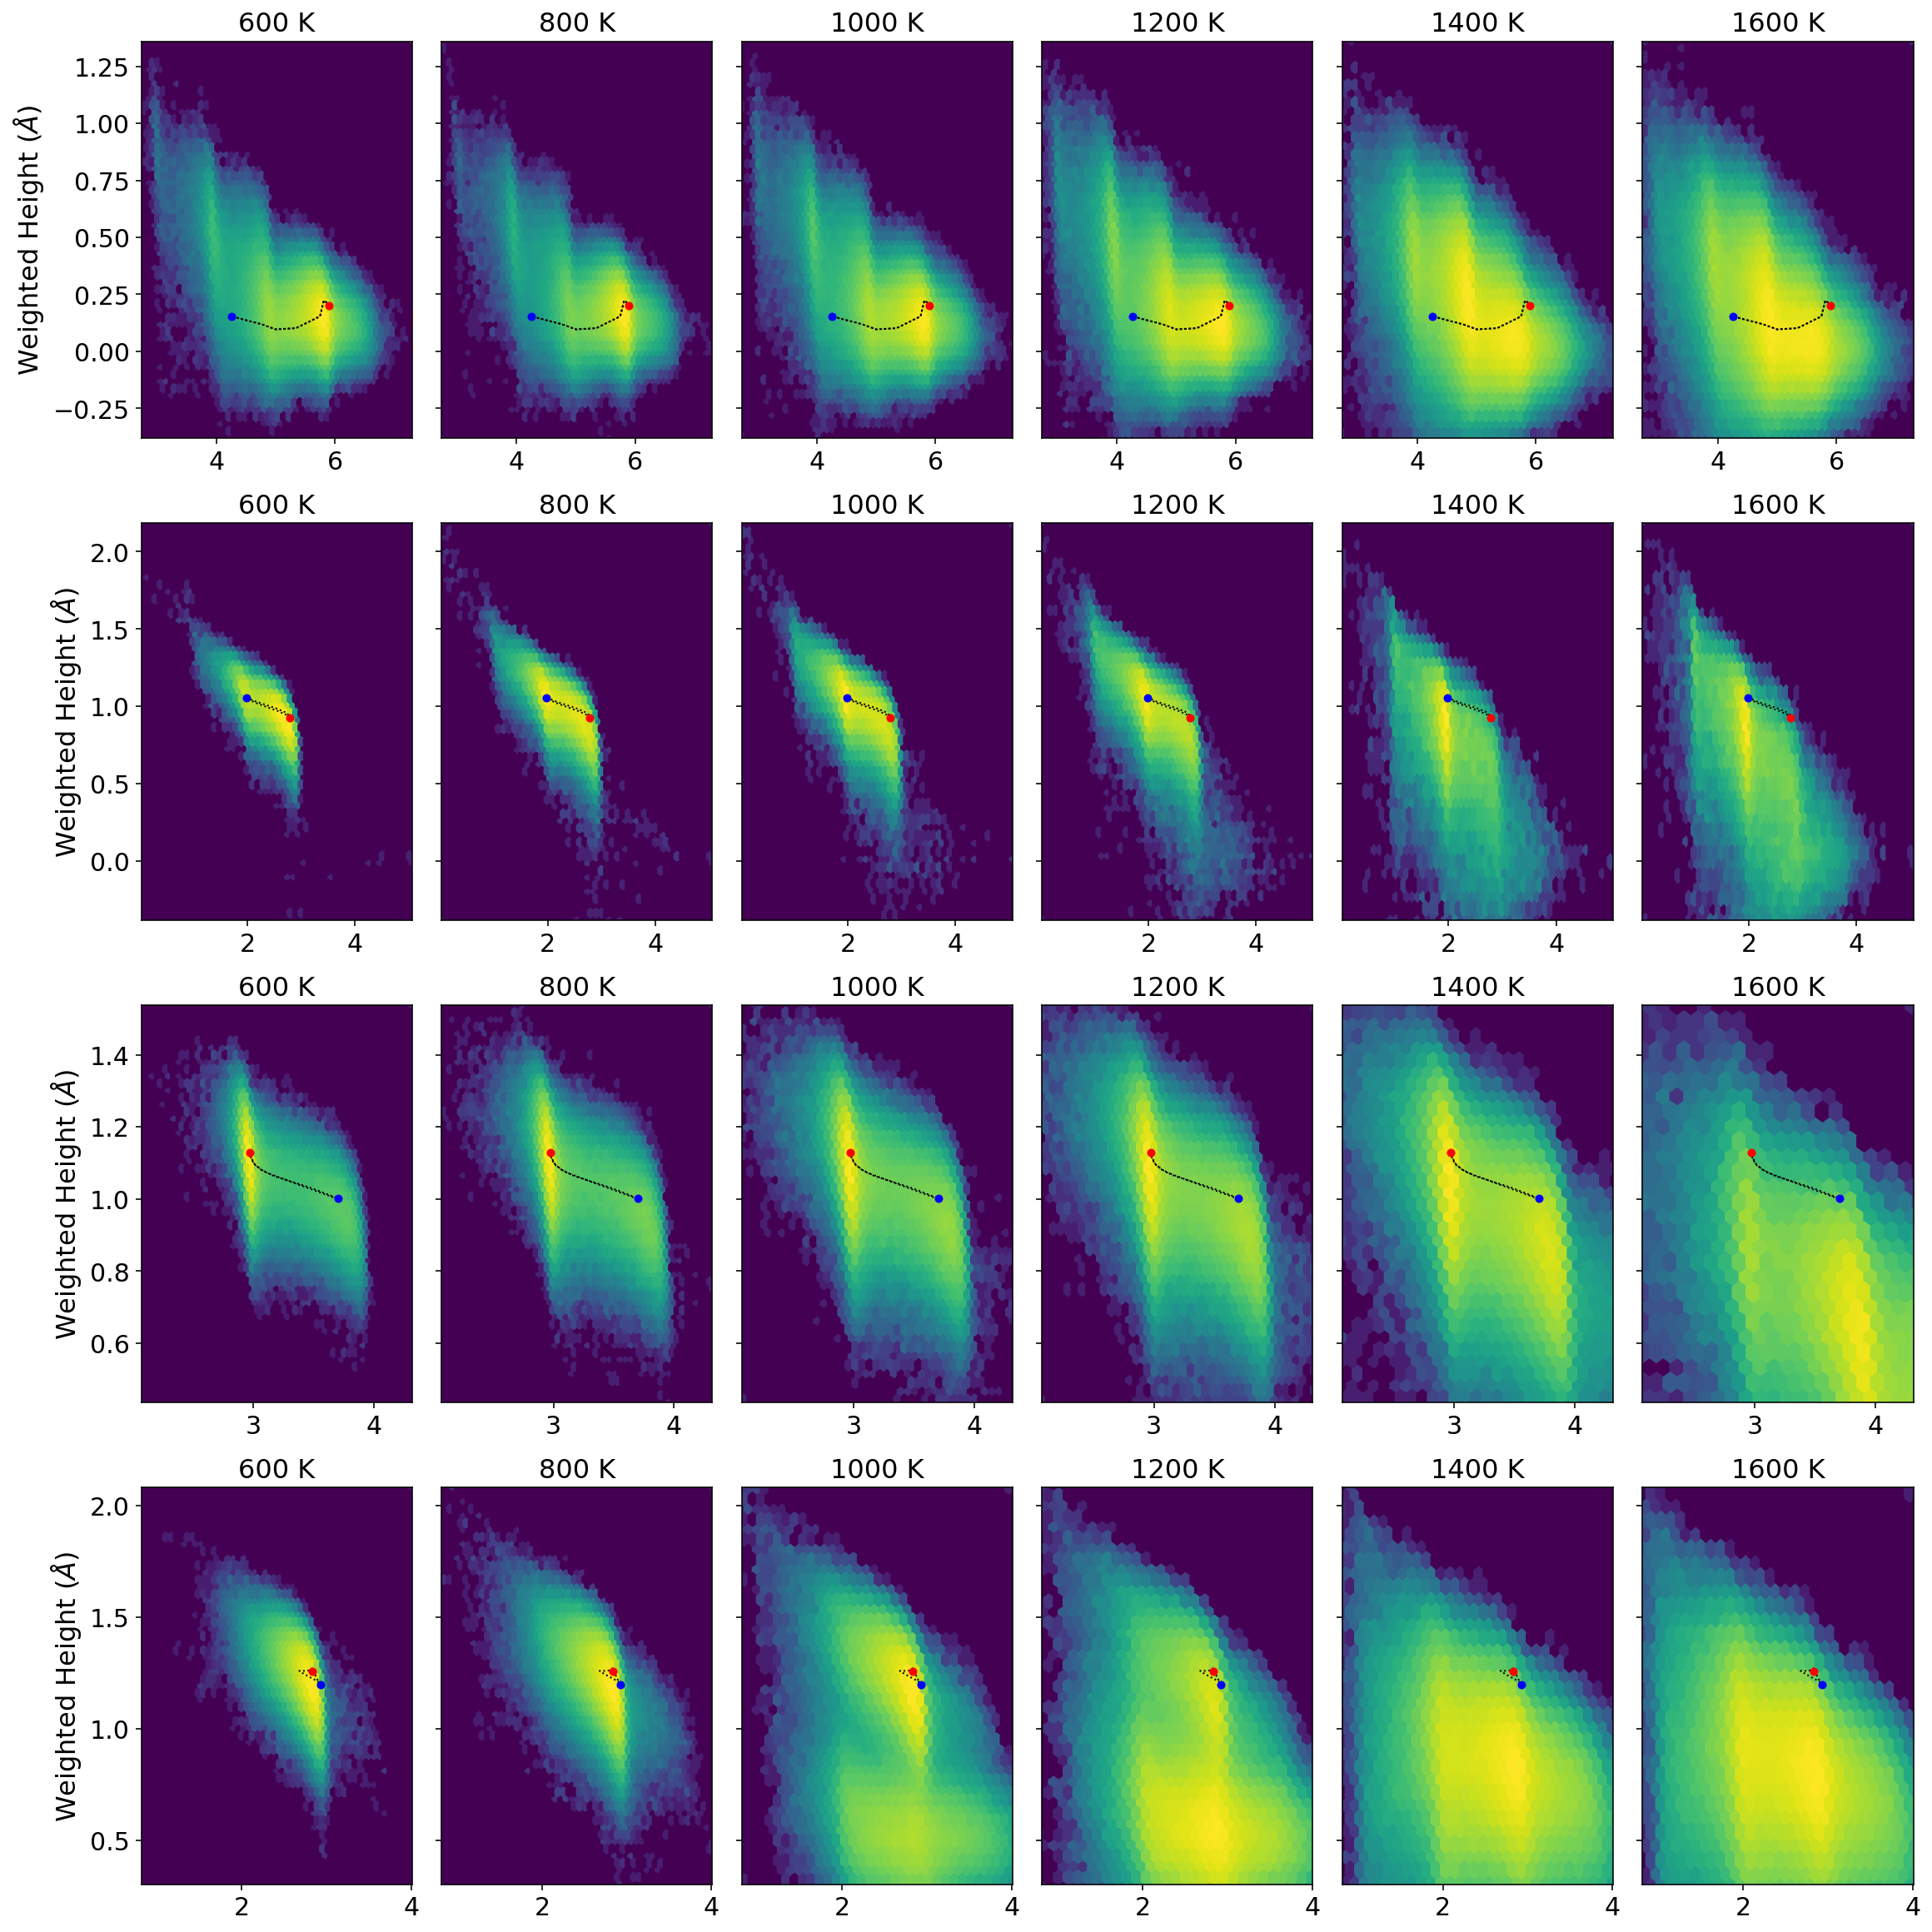
[149]:
import numpy as np
import matplotlib.pyplot as plt

eles=['C','H','CHs','C2']

fig, axs = plt.subplots(ncols=6,nrows=4, sharey='row', figsize=(16, 16),constrained_layout=True)
#fig.subplots_adjust(hspace=0.5, left=0.07, right=0.93)
#fig.subplots_adjust(bottom=0.07,top=0.93, left=0.07, right=0.93)

ind=0
for ele in eles:
    ind=ind+1
    neb=np.loadtxt(ele+'-neb-coordN')
    data=np.loadtxt(ele+'-800-coordN')
    x=data[:,0]
    y=data[:,1]
    xmin = x.min()
    xmax = x.max()
    ymin = y.min()
    ymax = y.max()

    T=[600,800,1000,1200,1400,1600]

    for i in range(6):
        filename=ele+'-'+str(T[i])+"-coordN"

        data=np.loadtxt(filename)
        if(ele=='C' or ele=='H'):
            box=[[xmin,ymin],[xmax,ymax]]
        else:
            box=[[xmin,ymin,0,0],[xmax,ymax,0,0]]
        data=np.append(data,box,axis=0)
        x=data[:,0]
        y=data[:,1]

        ax = axs[ind-1,i]
        hb = ax.hexbin(x, y, gridsize=50, bins='log', cmap='viridis')
        ax.set(xlim=(xmin, xmax), ylim=(ymin, ymax))
        ax.set_title(str(T[i])+" K",fontsize=16)
        if(i==0):
            ax.set_ylabel("Weighted Height ($\AA$)",fontsize=16)
        #cb = fig.colorbar(hb, ax=ax)
        #ax.plot(neb[:,0],neb[:,1],'w-')
        ax.plot(neb[:,0],neb[:,1],'k-',linewidth=1,linestyle='dotted')
        ax.plot(neb[0,0],neb[0,1],'ro',ms=4)
        ax.plot(neb[8,0],neb[8,1],'bo',ms=4)
        ax.tick_params(axis='both', which='major', labelsize=15)
        #cb.set_label('log10(N)')

plt.show()
[ ]: